How to Calculate TAM SAM SOM: Step-by-Step Guide with Examples
Most founders produce market size numbers without showing the math. This guide shows the exact bottom-up formula, three complete worked examples, and the sources investors actually accept.
Quick Answer
The bottom-up formulas:
TAM = Total potential customers × annual price
SAM = Target segment customers × your price point
SOM = Customers reachable via your channels × your price
Always show the customer count and the price separately. Always use bottom-up for SAM and SOM.
What each number means
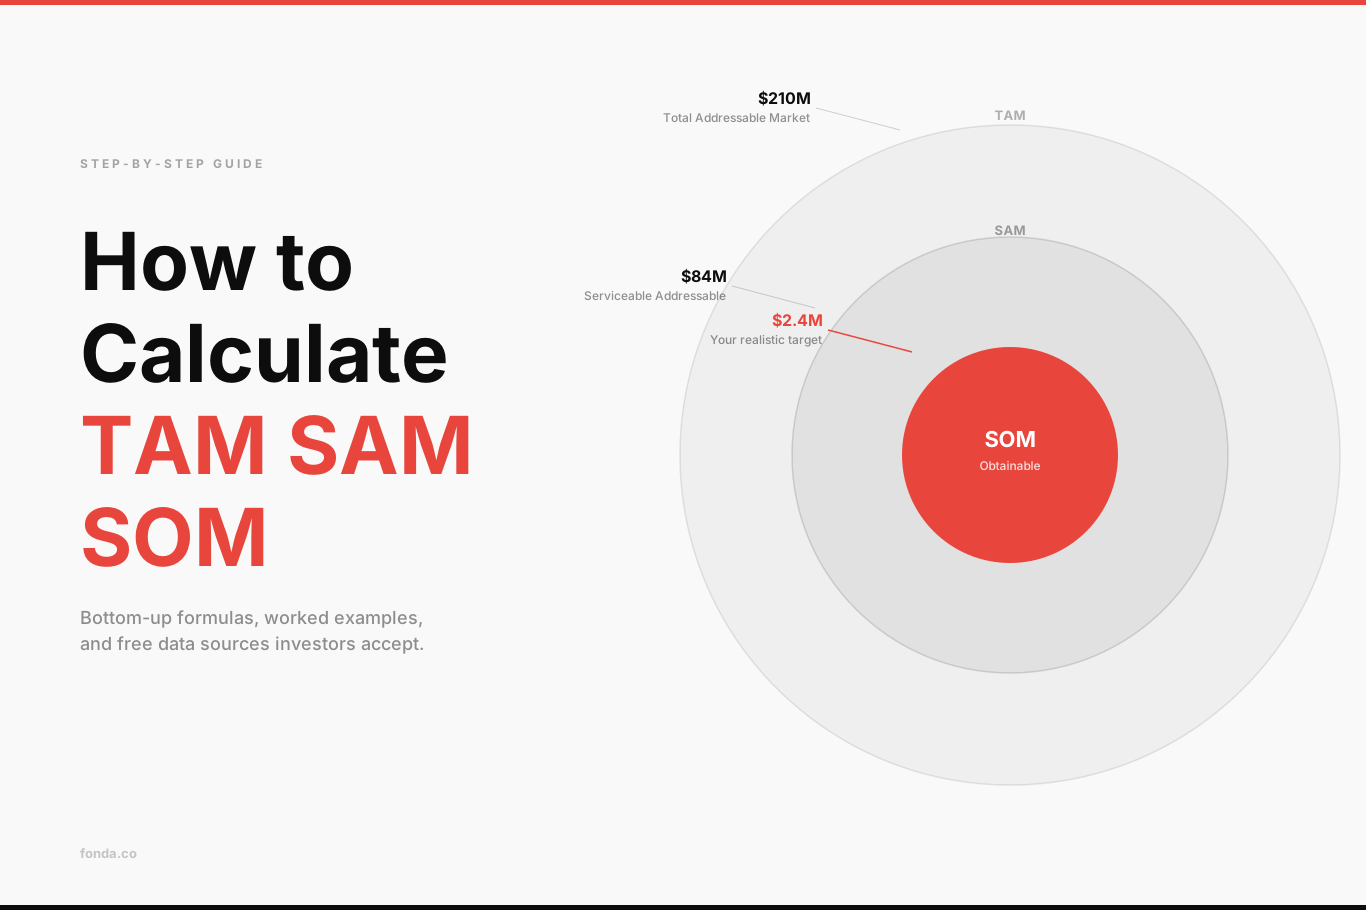
Total Addressable Market
The total revenue opportunity if you captured 100% of the market. Sets the ceiling for the opportunity. Used by investors to assess whether the space is large enough to build a venture-scale business.
Serviceable Addressable Market
The portion of TAM you can realistically serve with your current product, geography, and go-to-market model. This is the number that drives your actual growth plan. If your SAM is under $5M, it may not support a sustainable business.
Serviceable Obtainable Market
What you can actually capture in 1–3 years given your team, budget, and distribution channels. Your near-term revenue ceiling. Should be anchored to a specific acquisition plan, not a percentage of TAM.
The 5-step process for calculating TAM SAM SOM
Define your exact customer unit
Not 'small businesses' or 'marketing professionals' — define by job title, company size, industry, geography, and specific trigger that makes them need your product. The more specific, the more credible your SAM calculation will be.
Count the potential customers
Use primary sources: Census Bureau (business counts by NAICS), LinkedIn (professional role counts), SBA data, Companies House (UK). Investors will check your sources. If you've invented the number, they'll know.
Establish the annual price per customer
Use your actual planned price point for SAM and SOM. For TAM, you can use the average market price. Show price as a separate variable — '280,000 restaurants × $600/year' is more credible than '$168M SAM' with no breakdown.
Apply filters to calculate SAM
Which customers are actually reachable with your current model? Filter by: geography (can you serve UK from a US base?), segment (enterprise tools won't work for SMBs), and fit (does your product actually solve their problem?). SAM is usually 20–60% of TAM.
Tie SOM to a distribution plan
SOM is not a percentage of SAM you picked arbitrarily. It's the number of customers you can reach via your specific acquisition channels, with your specific CAC and conversion rate. Show the math: 'We can reach 10,000 potential customers via outbound with a 5% conversion rate = 500 customers/year.'
3 worked examples with real math
Each example below shows the complete calculation — customer count, price, filters, and sources — for three common startup types.
B2B SaaS: HR compliance tool for US restaurants
Independent and small-chain restaurant groups (2–20 locations) in the US that manage HR manually or in spreadsheets.
TAM — total market
~1M US restaurants with salaried staff × $600/year (avg HR software spend) = $600M TAM
Source: National Restaurant Association (2025), median software spend from G2 buyer surveys.
SAM — serviceable segment
Independent restaurants and small chains (2–20 locations, 5–50 employees) = 280,000 × $600 = $168M SAM
Filtered to exclude franchises (have corporate tools) and very small (no formal HR). Census NAICS data.
SOM — 3-year capture
Year 3: 4,200 customers via direct outreach + industry media × $600 = $2.5M ARR
4,200 out of 280,000 = 1.5% share. Achievable via niche community (restaurant owners Facebook groups, NRA events).
Verdict
$2.5M SOM at 1.5% of SAM. Solid bootstrapped business; tight beachhead before expanding to retail or hospitality.
Consumer app: financial literacy for Gen Z
18–28-year-olds in the US who are actively trying to improve their personal finances (budgeting, saving, first investments).
TAM — total market
54M people aged 18–28 in the US × $96/year (avg fintech app subscription) = $5.2B TAM
US Census population data. $8/month subscription benchmark from Robinhood, Acorns, Mint Pro pricing.
SAM — serviceable segment
Active finance-interested subset (approx 22%) = 12M × $96 = $1.15B SAM
22% benchmark from Pew Research 'financially engaged' young adults.
SOM — 3-year capture
Year 3: 60,000 subscribers via TikTok organic + creator partnerships × $96 = $5.8M ARR
60,000 of 12M = 0.5% share. Lower than typical due to high CAC for consumer apps. Requires strong organic content.
Verdict
$5.8M SOM at 0.5% of SAM. Consumer apps have high TAM but low SOM percentages — this is realistic, not pessimistic.
Marketplace: freelance bookkeepers for US SMBs
US small businesses (1–20 employees) that need part-time bookkeeping but can't afford a full-time hire.
TAM — total market
~6M US SMBs with 1–20 employees × $3,600/year (avg bookkeeping spend) = $21.6B TAM
SBA business statistics. $300/month average for outsourced bookkeeping from Bench and Pilot pricing.
SAM — serviceable segment
Businesses open to freelance/remote booking (estimated 40%) = 2.4M × $3,600 = $8.6B SAM
Filtered to exclude businesses that want on-site bookkeeping or already have in-house staff.
SOM — 3-year capture
Year 3: 6,000 active client relationships (marketplace commission = 15%) × $3,600 × 0.15 = $3.2M revenue
Note: marketplace revenue is commission, not GMV. 6,000 of 2.4M = 0.25% marketplace penetration — typical for early-stage.
Verdict
$3.2M revenue at 0.25% penetration. Marketplace requires careful denominator: total revenue vs. your take rate.
Free data sources investors accept
Investors will ask where your numbers come from. These are the sources that pass the credibility check — all free or accessible.
| Source | Best for |
|---|---|
| US Census Bureau | Business counts by industry (NAICS codes), population demographics, employment stats |
| Bureau of Labor Statistics | Industry employment, sector wage data, occupation counts |
| Statista / IBISWorld | Industry market size reports, sector growth rates (paid, often available via library access) |
| Crunchbase / PitchBook | Funding data, comparable company valuations, sector sizing signals |
| G2 / Capterra buyer surveys | Software spending benchmarks by company size and category |
| LinkedIn Sales Navigator | Professional segment sizing, role counts, company filtering by size/industry |
| Companies House (UK) | UK business registration data, sector headcounts |
| SBA Small Business Data | US SMB counts, employment ranges, industry distribution |
The 4 mistakes that kill market size credibility
Using the total industry as your TAM
The global healthcare market is $10T. That's not your TAM unless you're building a solution for every health interaction on earth. TAM must be the revenue opportunity for your specific type of solution in your addressable geography.
Not showing the customer count separately
'Our SAM is $300M' without showing how many customers that represents is a red flag. Investors want to see: 150,000 companies × $2,000 = $300M. The customer count is the checkable part.
Using the same price for TAM and SAM
Your product may be priced at a premium to the market average. If the market average ACV is $500/year and your product is $1,200/year, your SAM reflects your price — not the market average. Distinguish clearly.
A SOM with no distribution attached
'We expect to capture 2% of our SAM in 3 years' is meaningless without a channel. '2% via LinkedIn outbound with a $150 CAC and 8% conversion on cold outreach' is a business plan.
Free tool
Calculate your TAM SAM SOM in 60 seconds
Describe your idea and get a market size estimate as a starting point for your own bottom-up calculation.
Frequently asked questions
What is the formula for TAM SAM SOM?+
Bottom-up formulas: TAM = (total potential customers globally or in your addressable geography) × (annual revenue per customer). SAM = (customers in your target segment who meet your product, geography, and model constraints) × (your specific price point). SOM = (customers you can realistically acquire via your distribution channels in 3 years) × (your price point). Always show the customer count and the price as separate numbers — investors will check both.
Should I use top-down or bottom-up for TAM?+
Bottom-up is almost always more credible. Top-down (starting from an industry report number and taking a percentage) is acceptable for TAM context only, to set the ceiling. But for SAM and SOM — the numbers that drive your actual business plan — always use bottom-up: real customer counts multiplied by your real price. "We're targeting 1% of the $50B market" is not a business plan; it's a bad substitute for math.
How do I find market size data for free?+
Best free sources: US Census Bureau (NAICS business counts), Bureau of Labor Statistics (employment by occupation), LinkedIn (professional role counts via people search), Crunchbase (competitor funding as a market proxy), SBA data (SMB counts by industry), and company annual reports (if public competitors exist, their revenue is public). For B2C markets: Pew Research and government census data cover consumer behavior and demographics without a paywall.
What percentage of SAM should my SOM be?+
1–5% of SAM is the benchmark investors use for early-stage companies. Less than 1% raises questions about conviction or distribution capability. More than 10% requires exceptional justification — a structural cost advantage, an exclusive partnership, or network effects that compound. The key is that your SOM should be tied to a specific distribution plan: channel, message, cost per acquisition, and conversion rate.
How do I explain TAM SAM SOM to investors?+
Don't lead with the TAM number. Lead with the customer. Start with: 'There are X [specific customer type] in [geography]. We're targeting the subset who [narrow filter] — that's Y businesses. At $Z/year, our SAM is $Y × Z = [number]. In three years, via [specific channel], we can reach A% of SAM, giving us [SOM ARR].' Then show the growth rate of the market with a source. This structure shows you know your customer and have thought about distribution — the two things that matter most.
Related reading
How to Write a Business Plan for a Startup
Market size is section 3 — here's the full plan
Lean Canvas vs Business Model Canvas
A one-page model before you size the market
Why Startup Ideas Fail Before They Launch
Market sizing alone doesn't validate demand
First-Time Founder Checklist
Where market sizing fits in the founder journey